Biphasic dose response means that photobiomodulation (PBM) follows a characteristic curve where low doses stimulate, moderate doses produce optimal effects, and high doses inhibit cellular function. This phenomenon — described by the Arndt-Schulz principle and validated extensively in PBM research (Huang et al., 2009) — explains why more light is not always better.
However, the specific optimal dose depends critically on context: in laboratory cell cultures, optimal direct doses are typically 0.5–4 J/cm², while clinical LED devices routinely deliver 10–60 J/cm² at the skin surface with positive outcomes — because tissue attenuation means only a fraction of surface energy reaches the target cells. Understanding this distinction between surface fluence and tissue-level dose is essential for interpreting dosing science correctly.
Introduction
In the world of light therapy, intuition suggests that more power equals better results. A brighter device should work faster, right? Surprisingly, the science says no. Photobiomodulation follows a biphasic dose response — a biological principle where the relationship between dose and effect is not linear but follows a characteristic bell-shaped curve.
This concept — first described by Rudolf Arndt and Hugo Schulz in the late 19th century as a general principle of biological response to stimuli — states that weak stimuli excite biological systems, moderate stimuli optimize function, and strong stimuli inhibit or damage. In PBM, this means that exceeding optimal light parameters can actually be counterproductive.
An important qualification: The Arndt-Schulz principle was never formally accepted as a universal pharmacological law, and its status in mainstream toxicology remains debated. However, the specific biphasic dose-response pattern it describes has been independently and repeatedly validated in PBM through controlled experimental studies (Huang et al., 2009; Hawkins & Abrahamse, 2006). The phenomenon is real, regardless of how one labels the theoretical framework.
Understanding biphasic dosing is critical for:
- Device manufacturers: Engineering optimal irradiance and treatment durations, not just maximum power output
- Clinicians: Designing effective treatment protocols that avoid the inhibition zone
- B2B buyers: Evaluating device specifications beyond marketing claims [[6]][doc_6]
- Consumers: Setting realistic expectations and avoiding overuse
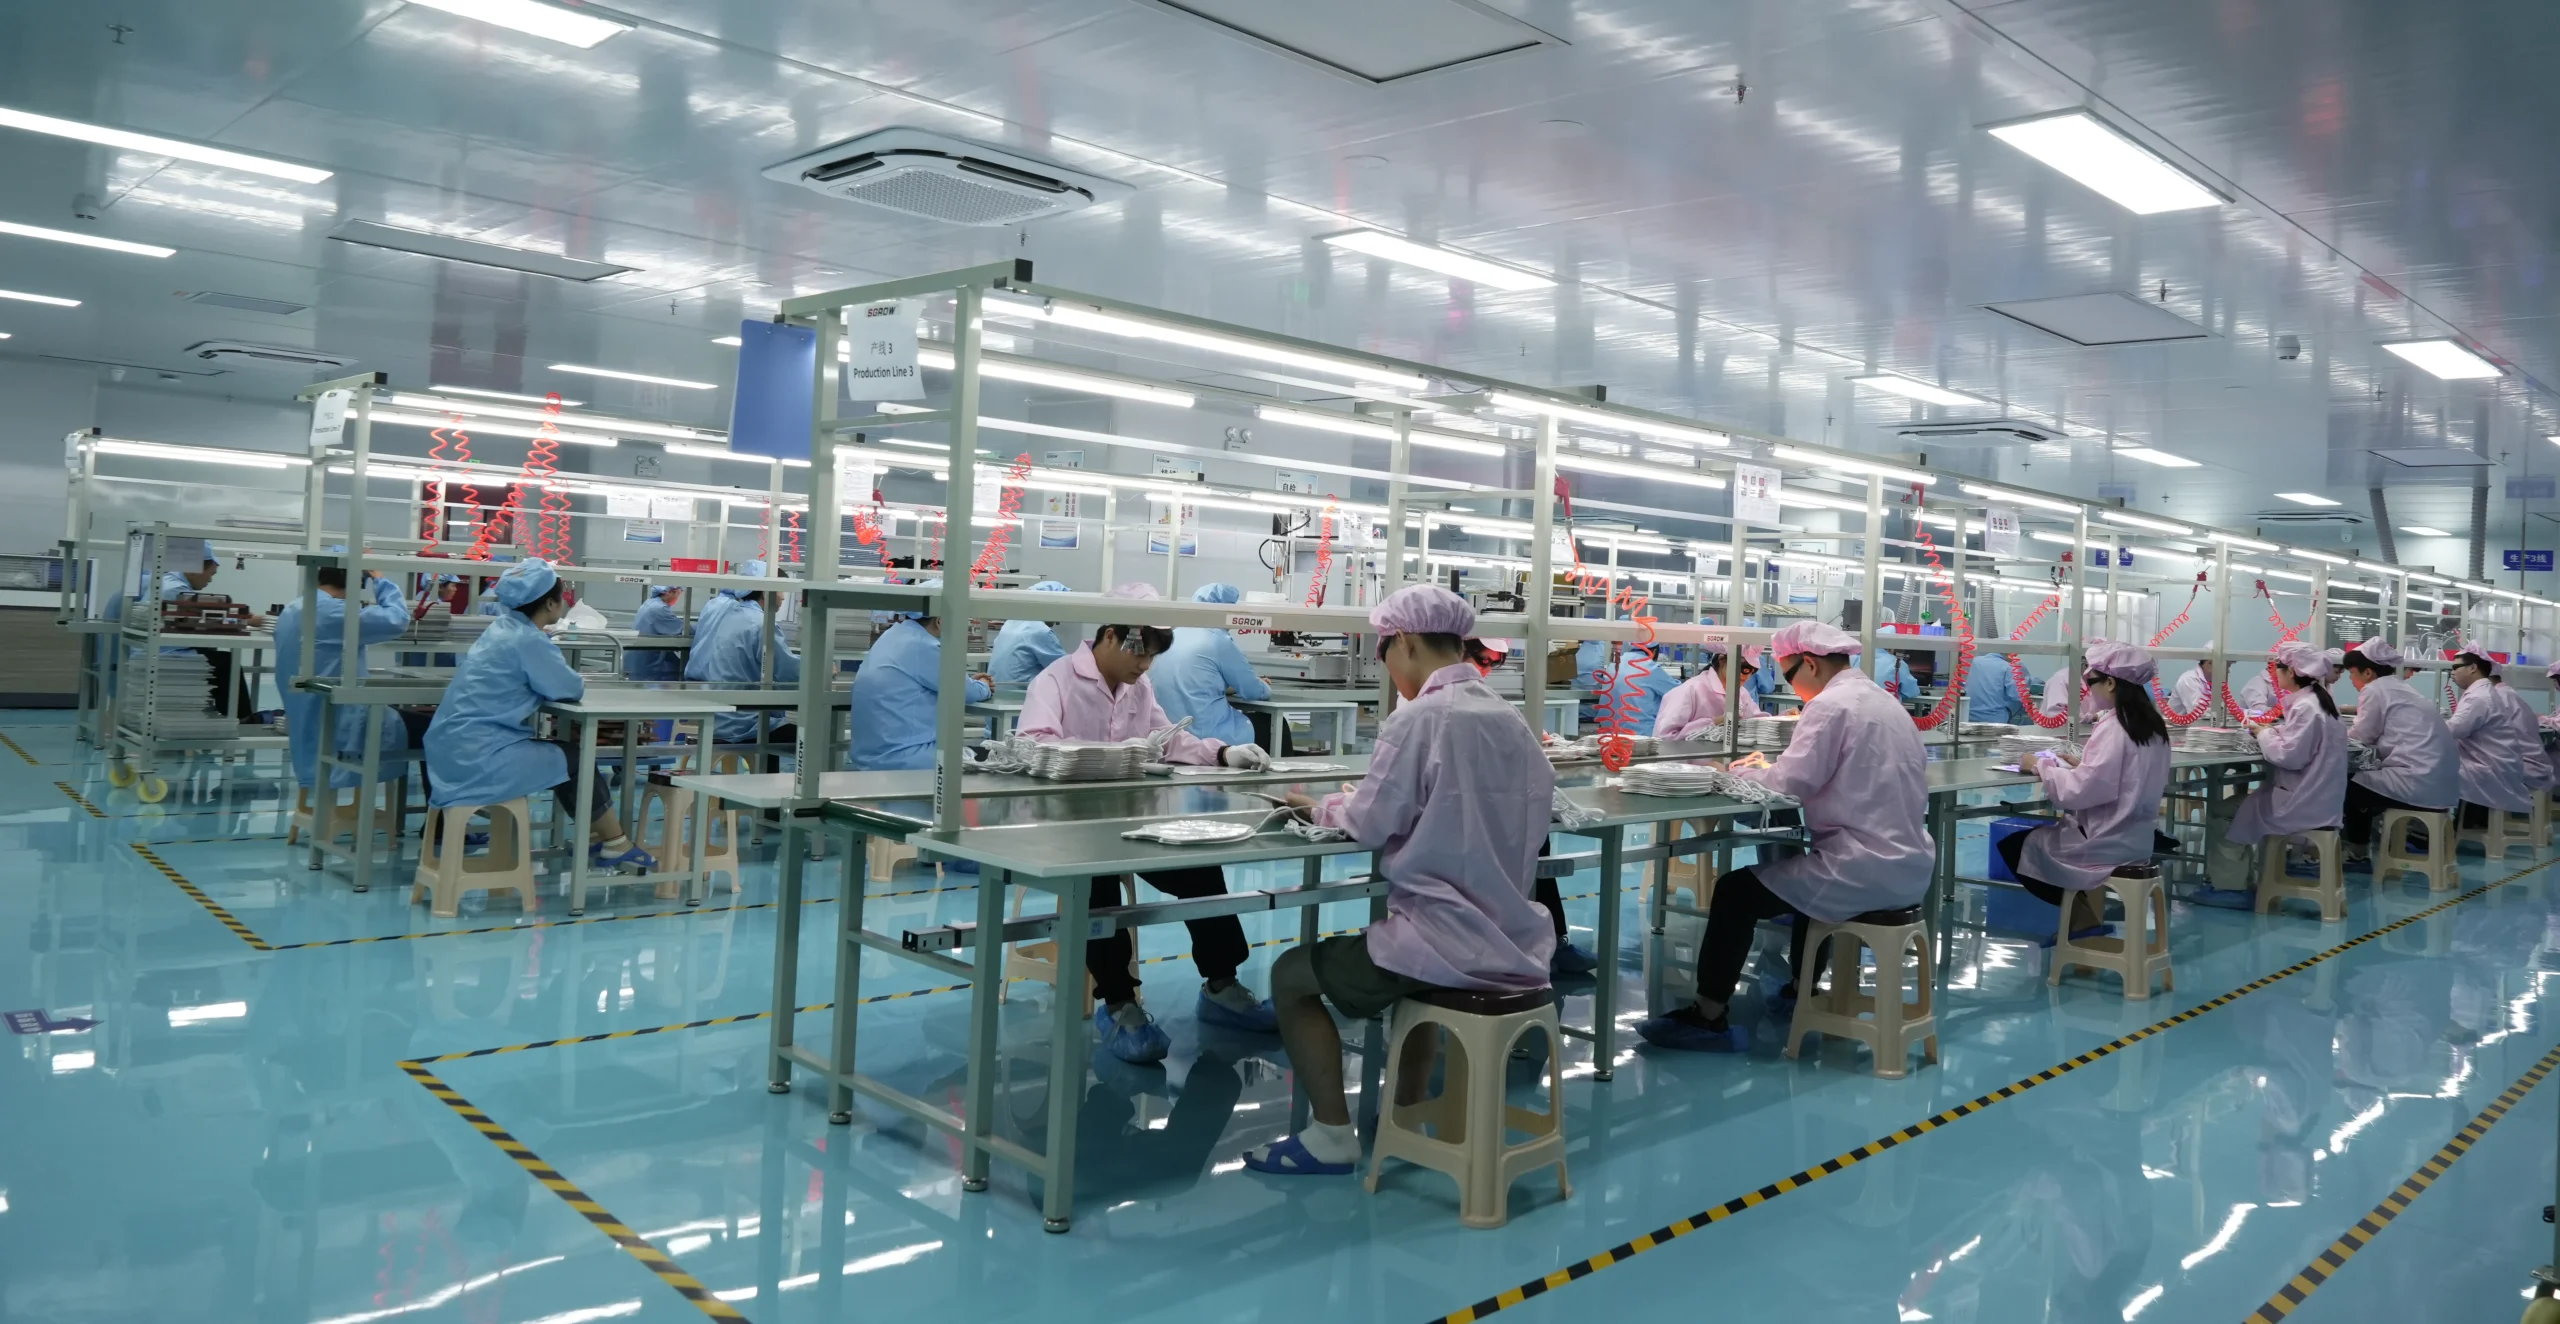
At WakeLife Beauty, our Quality & Compliance team ensures all devices are engineered with dosing parameters informed by the biphasic response literature, validated through internal irradiance verification testing.
The Curve Explained
The biphasic dose response in PBM follows this characteristic pattern:
Biphasic Dose-Response Curve (Arndt-Schulz Model)
| Dose Level | Phase | Effect | Description |
|---|---|---|---|
| Low | Stimulation Zone | ↗ Rising | Cells show initial responses: modest increases in ATP, early ROS signaling activation. Stimulus is insufficient for maximal benefit. |
| Moderate | Optimal Zone (Peak) | ⬆ Maximum |
THERAPEUTIC TARGET Cellular responses peak: maximum ATP enhancement, optimal gene expression, best clinical outcomes. |
| High | Inhibition Zone | ↘ Declining | CcO reaches saturation, ROS exceeds protective thresholds, cellular stress overrides therapeutic signal. Effects diminish. |
| Excessive | Inhibition Zone (deep) | ↘ Below baseline | Biological effect drops to — or below — the untreated baseline. Net outcome may become negative. |
The curve rises from low dose → peaks at moderate dose → declines through high dose → flattens or drops below baseline at excessive dose. Based on the biphasic model reviewed in Huang et al. (2009).
Visual summary: Imagine a hill — you climb (stimulation), reach the summit (optimal zone), then descend (inhibition). The goal of PBM dosing is to stay at or near the summit.
Phase 1 — Stimulation Zone (Suboptimal Dose) At very low doses, cells show initial responses: modest increases in ATP, early ROS signaling activation. However, the stimulus is insufficient for maximal therapeutic benefit. Clinical outcomes are suboptimal.
Phase 2 — Optimal Zone (Therapeutic Window) At moderate doses, cellular responses peak: maximum ATP production enhancement, optimal gene expression activation, and best clinical outcomes. This is the target for effective PBM.
Phase 3 — Inhibition Zone (Excessive Dose) Beyond the optimal window, additional photon energy becomes counterproductive: CcO reaches saturation, ROS production exceeds protective thresholds, and cellular stress responses override the therapeutic signal. Effects diminish or reverse.
Critical note on dose numbers: The specific J/cm² values defining each zone vary significantly depending on whether you’re measuring dose directly to isolated cells or at the skin surface with a clinical device. This distinction — explained in detail below — is the most commonly misunderstood aspect of PBM dosimetry.
Why Does Biphasic Response Occur?
Mitochondrial Mechanisms
The biphasic effect at the cellular level involves several interconnected mechanisms (Huang et al., 2009; Chung et al., 2012):
1. Cytochrome c Oxidase Saturation CcO has a finite number of chromophores (heme and copper centers) available to absorb photons at any given moment. At moderate irradiance, photon absorption optimally accelerates electron transport. At excessive irradiance, the enzyme’s absorption sites become saturated — additional photons cannot be productively used, and the excess energy dissipates as heat or drives counterproductive reactions. → See Topic 02: Cytochrome c Oxidase Mechanism for detailed CcO science.
2. Reactive Oxygen Species (ROS) Thresholds PBM induces a small, transient increase in mitochondrial ROS — and at moderate levels, these ROS serve as signaling molecules that activate protective pathways including NF-κB and Nrf2 (Hamblin, 2017). However, excessive light produces ROS beyond the cell’s antioxidant buffering capacity, tipping the balance from protective signaling to oxidative stress.
This ROS threshold mechanism is the most well-supported molecular explanation for the biphasic curve (Huang et al., 2009).
3. Calcium Signaling Dynamics Light-induced changes in mitochondrial membrane potential affect intracellular calcium levels. Moderate calcium transients activate beneficial transcription factors. Excessive or prolonged calcium elevation can trigger mitochondrial dysfunction and apoptotic signaling.
4. Thermal Contribution at High Irradiance At very high irradiance levels (significantly above therapeutic ranges), tissue heating exceeding 1°C can occur. This thermal effect — independent of the photochemical mechanism — can trigger heat-shock and protective responses that interfere with the therapeutic photochemical signal (Chung et al., 2012).
Surface Fluence vs. Tissue Dose: The Critical Distinction
This section addresses the single most common source of confusion in PBM dosimetry. Without understanding this distinction, the dose numbers cited in research papers, device specifications, and clinical protocols appear contradictory.
Two Different Measurements, Same Unit
Both “surface fluence” and “tissue-level dose” are measured in J/cm², but they refer to very different things:
| Term | What It Measures | Where It Applies |
|---|---|---|
| Surface fluence (also: surface energy density) | Total energy per cm² delivered at the skin surface by the device | Device specifications, clinical protocols, treatment planning |
| Tissue-level dose (also: effective dose at target) | Energy per cm² actually reaching the biological target (e.g., dermal fibroblasts, muscle mitochondria) | Research literature (especially in vitro studies), mechanistic models |
Why They’re Different: Tissue Optical Attenuation
When light enters biological tissue, it undergoes significant attenuation through:
- Reflection at the skin surface (~4–7% for perpendicular incidence)
- Scattering by tissue structures (epidermis, dermis, collagen fibers)
- Absorption by non-target chromophores (melanin, hemoglobin, water)
The result: only a fraction of the surface fluence reaches the target cells.
Approximate transmission to common target depths for therapeutic wavelengths:
| Wavelength | Target Depth | Transmission | Source |
|---|---|---|---|
| 660 nm (Red) | Upper dermis (~1 mm) | ~15–30% | Chung et al. (2012) |
| 660 nm (Red) | Deep dermis (~2–3 mm) | ~5–15% | Chung et al. (2012) |
| 850 nm (NIR) | Muscle (~5 mm) | ~10–20% | Chung et al. (2012) |
| 850 nm (NIR) | Brain through skull | ~2–5% | Chung et al. (2012) |
Note: These are approximate ranges. Actual transmission varies with skin type (melanin content), anatomical location, tissue hydration, and individual physiology. Fitzpatrick skin types V–VI will have greater melanin-mediated attenuation than types I–II.
Resolving the Apparent Contradiction
This distinction resolves what otherwise appears to be a contradiction in PBM literature:
In vitro (cell culture) studies typically report optimal effects at 0.5–4 J/cm² delivered directly to cells — because there is no tissue attenuation (Hawkins & Abrahamse, 2006).
Clinical LED device studies typically report effective surface fluences of 10–60 J/cm² — because the device must deliver significantly more energy at the surface to ensure sufficient photons reach the target tissue after attenuation.
Worked Example — Surface Fluence to Tissue Dose:
| Parameter | Value |
|---|---|
| Device surface fluence | 40 J/cm² |
| Tissue attenuation (660 nm to upper dermis) | ~75% loss (25% transmission) |
| Effective dose at dermal fibroblasts | ~10 J/cm² (40 × 0.25) |
Interpretation: The 10 J/cm² at the cellular level is within the range where in vitro studies show optimal biphasic response. The 40 J/cm² surface fluence is not excessive — it is the appropriate surface dose to deliver an effective tissue-level dose after attenuation.
This is why a well-designed LED face mask delivering 30–60 J/cm² at the skin surface is not in the inhibition zone — it’s engineered to deliver an effective tissue-level dose within the optimal window after accounting for attenuation.
The clinical trial by Wunsch & Matuschka (2014) provides direct validation: an LED device delivering approximately 30 J/cm² surface fluence (combination of 611–650 nm and 850–880 nm) produced statistically significant improvements in skin complexion, wrinkle severity, and intradermal collagen density — confirming that surface fluences in this range are therapeutically effective, not inhibitory.
Why This Matters for Evaluating Devices
When evaluating a PBM device, you must consider:
- The surface fluence (calculated from irradiance × time) — this is what the device delivers
- The target tissue depth — this determines how much attenuation occurs
- The wavelength — longer wavelengths (NIR) penetrate deeper with less attenuation than shorter wavelengths (red)
- The effective tissue dose — this is what ultimately determines biological effect
A device that appears to deliver a “high” surface fluence may be appropriately calibrated for deeper targets. Conversely, a device with a “low” surface fluence may be perfectly adequate for superficial skin applications.
Clinical Evidence for Biphasic Dosing
Key Research
Huang et al. (2009) — The Definitive Biphasic Dose Response Review The most comprehensive analysis of biphasic dosing in PBM. Reviewed dozens of studies across cell cultures, animal models, and clinical applications. Established that the biphasic pattern is a fundamental characteristic of PBM, not an artifact. Linked the phenomenon to ROS thresholds, CcO saturation, and cellular stress responses. This paper remains the primary reference for anyone studying PBM dose-response relationships. → PubMed: 20011653
Hawkins & Abrahamse (2006) — Direct In Vitro Demonstration Demonstrated the biphasic response in wounded human skin fibroblasts using a HeNe laser (632.8 nm). Cell viability and proliferation peaked at moderate fluences (2.5 and 5 J/cm²), while higher fluences (10 and 16 J/cm²) caused reduced viability and membrane damage. This study provides some of the clearest direct evidence for biphasic dosing at the cellular level. → PubMed: 16706699
Wunsch & Matuschka (2014) — LED Clinical Validation A controlled clinical trial using an LED device (combination of 611–650 nm and 850–880 nm) with approximately 30 J/cm² surface fluence per session, treated twice weekly for 30 sessions. Results showed statistically significant improvements in skin complexion, wrinkle reduction, and increased intradermal collagen density measured by ultrasound. This study is particularly relevant because it validates LED device dosing parameters similar to those used in commercial face masks. → PubMed: 24286286
Chung et al. (2012) — Comprehensive PBM Mechanistic Review The most-cited review in PBM literature (2,000+ citations). Synthesizes the dose-response evidence alongside the complete mechanistic chain from photon absorption to clinical outcomes. Discusses tissue optics, attenuation factors, and the importance of distinguishing between delivered dose and effective tissue dose. → PubMed: 22045511
Karu et al. (2005) — CcO Saturation Mechanism While primarily focused on identifying CcO as the primary chromophore, this work also established the basis for understanding CcO’s finite absorption capacity — the molecular mechanism underlying the high-dose saturation that contributes to biphasic response. → PubMed: 16848227
Practical Dosing Guidelines
Calculating Surface Fluence
The basic formula for calculating the energy density delivered at the device surface:
Surface Fluence Calculator
| Irradiance | Time | Calculation | Fluence | Context |
|---|---|---|---|---|
| 30 mW/cm² | 10 min (600 s) | 30 × 600 ÷ 1000 | 18 J/cm² | Low-power panel, moderate session |
| 50 mW/cm² | 10 min (600 s) | 50 × 600 ÷ 1000 | 30 J/cm² | Mid-range device, standard session |
| 100 mW/cm² | 5 min (300 s) | 100 × 300 ÷ 1000 | 30 J/cm² | Higher-power device, shorter session |
| 65 mW/cm² | 10 min (600 s) | 65 × 600 ÷ 1000 | 39 J/cm² | LED face mask, typical session |
Important: These are all surface fluences. The effective dose at the target tissue will be significantly lower due to tissue attenuation (see previous section). For facial skin applications using red LEDs (660 nm), a surface fluence of 30–60 J/cm² typically corresponds to an effective dermal dose in the range that in vitro studies show optimal cellular response.
Clinical Surface Fluence Ranges by Application
Based on published clinical studies and reviews:
| Application | Surface Fluence | Wavelength(s) | Key References |
|---|---|---|---|
| Facial skin rejuvenation | 20–60 J/cm² | 630–660, 830–850 nm | Wunsch & Matuschka (2014) |
| Wound healing | 4–30 J/cm² | 630–660 nm | Reviewed in Chung et al. (2012) |
| Musculoskeletal pain | 10–40 J/cm² | 810–850 nm | Reviewed in Chung et al. (2012) |
| Joint inflammation | 8–30 J/cm² | 810–850 nm | Reviewed in Hamblin (2017) |
| Transcranial PBM | 10–60 J/cm² (scalp) | 810 nm | Reviewed in Chung et al. (2012) |
Note: These ranges are compiled from the cited reviews and represent commonly used parameters in published studies. Individual studies vary. Ranges represent surface fluence (energy density at the device/skin interface), not tissue-level dose.
Mapping In Vitro to Clinical Dosing
To connect the in vitro evidence to clinical parameters:
| Level | Optimal Range | Inhibition Threshold | Source |
|---|---|---|---|
| In vitro (direct to cells) | 0.5–4 J/cm² | >10–16 J/cm² | Hawkins & Abrahamse (2006) |
| Clinical surface fluence (skin) | 10–60 J/cm² | Context-dependent; >100 J/cm² | Wunsch & Matuschka (2014); Chung et al. (2012) |
The gap between these ranges is accounted for by tissue optical attenuation. A clinical surface fluence of 40 J/cm² that delivers ~4–10 J/cm² to dermal cells is consistent with the in vitro optimal window.
WakeLife Beauty Dosing Standards
Our Research & Development team designs dosing parameters based on the biphasic response literature and clinical LED trial data [[1]][doc_1]:
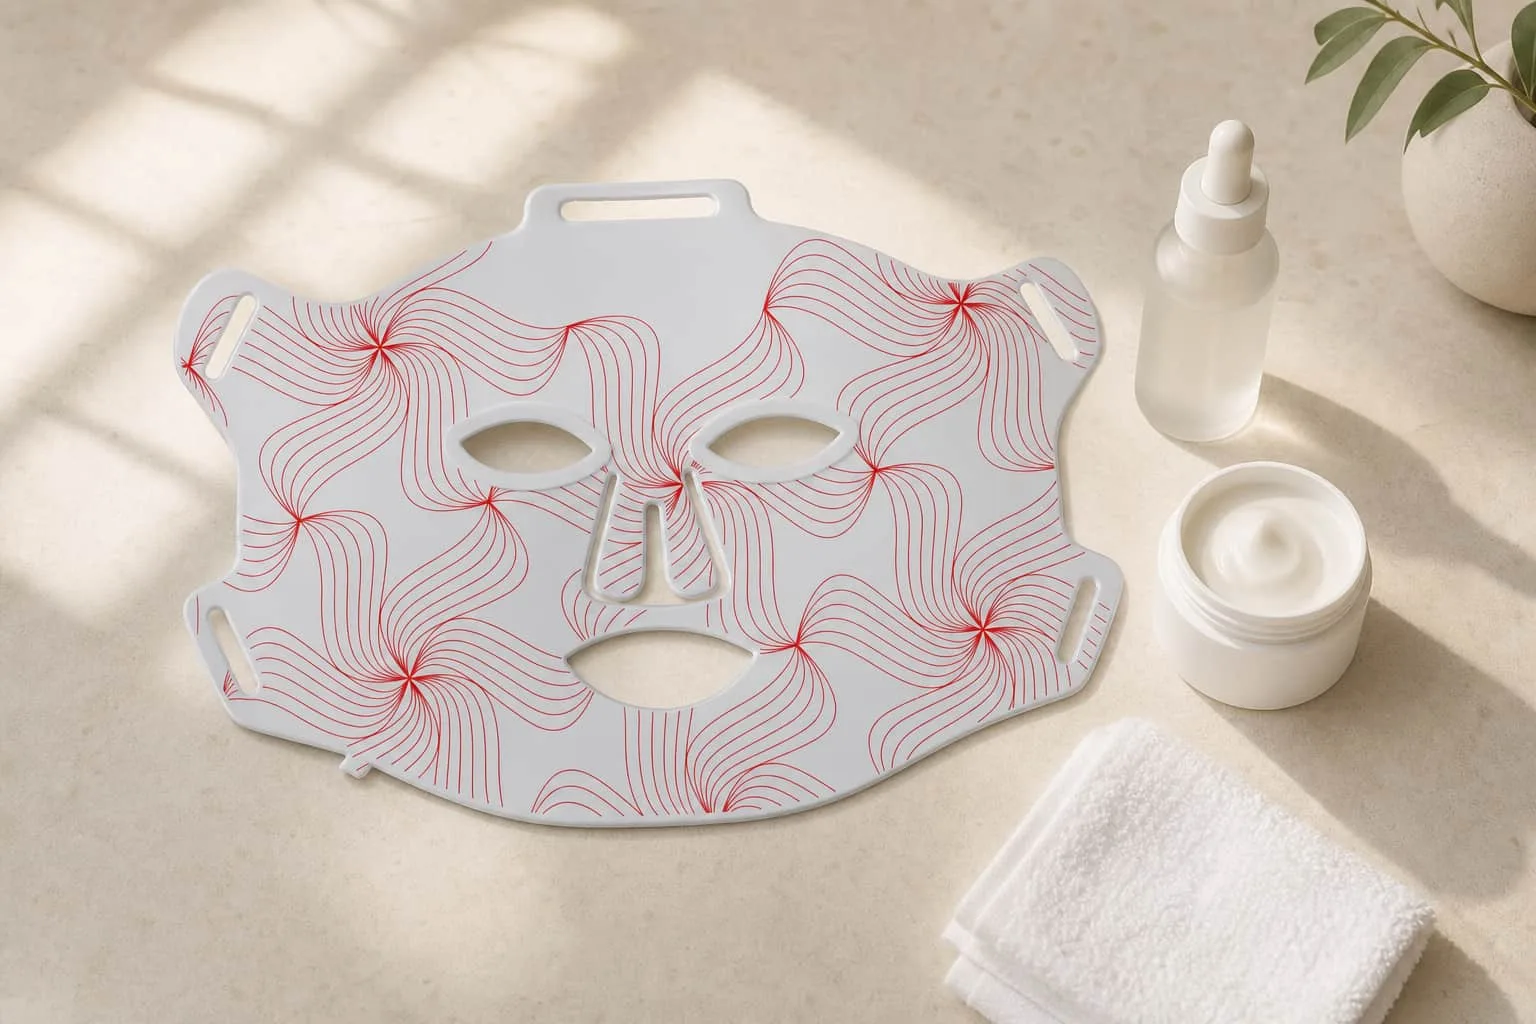
LED Face Masks:
- Irradiance: ~65 mW/cm² at skin contact surface
- Recommended treatment: 10–15 minutes
- Surface fluence delivered: ~39–58.5 J/cm²
- Estimated effective dermal dose (660 nm, upper dermis): ~6–15 J/cm²
- Rationale: Surface fluence aligns with the range validated in the Wunsch & Matuschka (2014) LED clinical trial. Estimated tissue-level dose falls within the optimal zone identified in in vitro studies.
Therapy Panels (body applications):
- Irradiance: 100–150 mW/cm² at surface
- Recommended treatment: 8–12 minutes at 15–20 cm distance
- Surface fluence delivered: varies with distance (irradiance decreases with distance per inverse square law)
- Rationale: Higher surface irradiance compensates for greater tissue depth targets (muscle, joints) and treatment distance. Parameters informed by clinical ranges for musculoskeletal applications reviewed in Chung et al. (2012).
Key Design Principles:
- Devices calibrated to deliver effective tissue-level doses within the optimal biphasic window — not to maximize surface power
- Built-in treatment timers prevent excessive session duration [[5]][doc_5]
- Distance and usage guidelines provided with every device
- Irradiance verified during manufacturing QC process [[2]][doc_2] [[5]][doc_5]
- Full Quality & Compliance documentation maintained for every production batch [[2]][doc_2]
Common Dosing Mistakes
Mistake 1: “More Power = Better Results”
The error: Assuming that a device with twice the irradiance will produce twice the benefit, leading to purchasing the highest-power device available or using devices far longer than recommended.
The reality: The biphasic curve means there is a diminishing return — and eventually a reversal — at excessive doses. A device at 300 mW/cm² used for 30 minutes delivers 540 J/cm² surface fluence. Even accounting for tissue attenuation, this risks delivering tissue-level doses well into the inhibition zone, where ROS production exceeds protective thresholds and cellular stress overrides the therapeutic signal (Huang et al., 2009).
The principle: More powerful devices allow shorter treatment times (achieving the same surface fluence faster), but they must be used with proportionally reduced treatment duration. Power without protocol is counterproductive.
Mistake 2: Ignoring Treatment Distance
The error: Assuming that device specifications at the surface or at zero distance apply at typical treatment distances.
The reality: For panels and devices used at a distance, irradiance decreases with distance (following approximately the inverse square law for divergent sources). A panel that delivers 150 mW/cm² at surface contact may deliver significantly less at 30 cm distance. This means the actual surface fluence at the treatment distance may be much lower than calculated from spec-sheet irradiance values.
The principle: Always consider irradiance at the actual treatment distance, not just at the device surface.
Mistake 3: One-Size-Fits-All Protocols
The error: Using the same treatment parameters for all applications — facial skin, deep muscle, joints.
The reality: Different targets are at different tissue depths and have different optical environments. A protocol optimized for facial skin (where the target dermis is 1–2 mm deep) will deliver suboptimal tissue-level doses to muscle or joints at 5–15 mm depth. Conversely, a deep-tissue protocol applied to facial skin could deliver excessive tissue-level doses to the superficial dermis.
The principle: Treatment parameters should be matched to the target tissue depth and the intended biological effect.
Mistake 4: Inconsistent Treatment Schedule
The error: Using devices sporadically or with highly variable durations.
The reality: PBM’s downstream effects — gene expression changes, collagen synthesis, inflammatory modulation — develop over days to weeks with consistent stimulation. Sporadic use fails to build the cumulative cellular adaptation that drives clinical outcomes. Variable durations mean variable doses, potentially alternating between suboptimal and excessive zones.
The principle: Consistency of dose and frequency is more important than intensity of any single session.
Frequently Asked Questions
What is biphasic dose response in red light therapy?
Biphasic dose response means that low doses of light stimulate cellular function, moderate doses produce optimal therapeutic effects, and excessive doses inhibit or reverse benefits. This pattern has been validated across numerous PBM studies (Huang et al., 2009) and is the scientific basis for why more light isn’t always better.
What is the optimal dose for red light therapy?
It depends on the context. In laboratory cell cultures, optimal direct doses are typically 0.5–4 J/cm² (Hawkins & Abrahamse, 2006). For clinical LED devices applied to facial skin, effective surface fluences typically range from 10–60 J/cm² — higher at the surface because tissue attenuation reduces the dose that actually reaches target cells. The key is that the effective tissue-level dose should fall within the optimal window.
Can too much red light therapy be harmful?
Red and NIR light therapy is not harmful in the way UV light is — it does not cause DNA damage or burns at therapeutic irradiance levels. However, exceeding optimal parameters can push cellular responses into the inhibition zone of the biphasic curve, reducing or reversing therapeutic benefits (Huang et al., 2009). This manifests as diminished results, not tissue damage. At extremely high irradiance levels, thermal effects (tissue heating) become an additional concern.
Does the biphasic curve apply to all wavelengths?
Yes. The biphasic pattern has been observed across the 600–1000 nm therapeutic range, though the specific optimal dose window may shift slightly depending on wavelength, chromophore absorption efficiency, and tissue penetration characteristics (Huang et al., 2009).
What happens at the molecular level when dose exceeds the optimal zone?
Excessive dose can: (1) saturate CcO’s photon absorption capacity, reducing electron transport efficiency (Karu et al., 2005); (2) produce ROS beyond the cell’s antioxidant buffering capacity, shifting from protective signaling to oxidative stress; (3) cause excessive intracellular calcium that triggers stress responses; and (4) at very high irradiance, produce tissue heating that activates inhibitory heat-shock pathways.
Conclusion
The biphasic dose response is one of the most important — and most commonly misunderstood — principles in photobiomodulation. It establishes that:
- More power ≠ better results — there is a defined optimal window
- Treatment time matters as much as device brightness — the total energy delivered determines the biological effect
- Surface fluence ≠ tissue-level dose — tissue attenuation means clinical devices must deliver significantly more than the in vitro optimal to achieve effective tissue-level dosing
- Consistency of protocol trumps intensity of any single session
For device manufacturers, respecting the biphasic curve means:
- Engineering products to deliver effective tissue-level doses within the optimal window — not maximizing surface power for marketing purposes
- Providing clear treatment protocols based on the evidence
- Calibrating irradiance with precision and verifying it during production [[5]][doc_5]
- Educating users about proper dosing
For users and B2B buyers evaluating devices:
- Look beyond headline irradiance numbers — ask what tissue-level dose the device actually delivers
- Follow manufacturer treatment protocols rather than assuming longer sessions are better
- Evaluate whether the manufacturer’s dosing rationale references actual clinical evidence
- Understand that both professional and home devices can be effective when properly calibrated within the biphasic window
At WakeLife Beauty, our R&D and Quality & Compliance teams work together to ensure every device is engineered with dosing parameters informed by the biphasic response literature [[2]][doc_2] [[5]][doc_5]. This commitment to evidence-based dosing — rather than a “more is better” arms race — distinguishes science-informed devices from generic LED products in a crowded market.
The biphasic curve is biology’s reminder that therapeutic effectiveness lies not in maximum force, but in optimal precision.
Related Topics
- Topic 01: Photobiomodulation — Definition, History & How It Works
- Topic 02: Cytochrome c Oxidase — The Primary Photoacceptor in Red Light Therapy
- Topic 04: Downstream Effects of PBM — ATP, Inflammation & Antioxidant Defense
- Topic 07: Irradiance, Energy Density & Dosimetry — Complete PBM Parameter Guide
View all 30 topics: Complete Red Light Therapy & Photobiomodulation Guide
References
Huang, Y. Y., Chen, A. C., Carroll, J. D., & Hamblin, M. R. (2009). Biphasic dose response in low level light therapy. Dose-Response, 7(4), 358–383. PubMed: 20011653
Chung, H., Dai, T., Sharma, S. K., Huang, Y. Y., Carroll, J. D., & Hamblin, M. R. (2012). The nuts and bolts of low-level laser (light) therapy. Annals of Biomedical Engineering, 40(2), 516–533. PubMed: 22045511
Hawkins, D., & Abrahamse, H. (2006). The role of laser fluence in cell viability, proliferation, and membrane integrity of wounded human skin fibroblasts following helium-neon laser irradiation. Lasers in Surgery and Medicine, 38(1), 74–83. PubMed: 16706699
Karu, T., Pyatibrat, L., & Kalendo, G. (2005). Photobiological modulation of cell attachment via cytochrome c oxidase. Photochemical & Photobiological Sciences, 4(5), 421–428. PubMed: 16848227
Hamblin, M. R. (2017). Mechanisms and applications of the anti-inflammatory effects of photobiomodulation. AIMS Biophysics, 4(3), 337–361. PubMed: 28748217
Wunsch, A., & Matuschka, K. (2014). A controlled trial to determine the efficacy of red and near-infrared light treatment in patient satisfaction, reduction of fine lines, wrinkles, skin roughness, and intradermal collagen density increase. Photomedicine and Laser Surgery, 32(2), 93–100. PubMed: 24286286