Biphasic dose response means that photobiomodulation (PBM) follows a characteristic curve where low doses stimulate, moderate doses produce optimal effects, and high doses inhibit cellular function. This phenomenon—also called the Arndt-Schulz curve—explains why more light is not always better. Optimal dosing typically falls in the range of 3-10 J/cm² with irradiance of 30-100 MW/cm², depending on tissue type and treatment goal. Exceeding these parameters can reduce or even reverse therapeutic benefits.
Introduzione
In the world of light therapy, intuition suggests that more power equals better results. A brighter device should work faster, right? Surprisingly, the science says no. Photobiomodulation follows a risposta alla dose bifasica—a biological principle where the relationship between dose and effect is not linear but follows a characteristic bell-shaped curve.
This concept, first described in the late 19th century by Rudolf Arndt and Hugo Schulz as the Arndt-Schulz law, states that weak stimuli stimulate biological systems, moderate stimuli optimize function, and strong stimuli inhibit or damage. In PBM, this means that excessive light can actually be counterproductive.
Understanding biphasic dosing is critical for:
- Device manufacturers: Engineering optimal irradiance and treatment times
- Clinicians: Designing effective treatment protocols
- B2B buyers: Evaluating device specifications beyond marketing claims
- Consumers: Setting realistic expectations and avoiding overuse
A WakeLife Beauty, Nostro Qualità & Conformità team ensures all devices are engineered within optimal dose parameters, validated through rigorous testing protocols.
The Arndt-Schulz Curve in PBM
Historical Background
The biphasic dose response in PBM has its roots in classical pharmacology:
1888: Arndt-Schulz Law
- Rudolf Arndt and Hugo Schulz proposed that weak stimuli excite, moderate stimuli optimize, and strong stimuli inhibit
- Originally applied to toxins and drugs
- Later extended to radiation and electromagnetic stimuli
1960s-70s: Application to Light
- Mester’s pioneering work in laser biostimulation revealed dose-dependent effects
- Low doses promoted wound healing; high doses caused inhibition
- Established the foundation for modern PBM dosing principles
2000s-Present: Molecular Understanding
- Research by Karu et al. and others identified CcO saturation mechanisms
- Biphasic effects linked to reactive oxygen species (ROS) thresholds
- Optimal dosing windows established for various applications
H3: The Curve Explained
The biphasic dose response in PBM can be visualized as follows:
Effect
  ↑
  │      ╭────╮
  │     ╱      ╲
  │    ╱   ↑    ╲
  │   ╱ Optimal  ╲
  │  ╱    Dose    ╲
  │ ╱                ╲
  │╱                  ╲____
  └────────────────────────→ Dose
   Low   Moderate   High

Fase 1: Stimulation Zone (Low Dose)- 0.1-1 J/cm²: Initial cellular response
- ROS signaling activation
- Modest ATP increase
- Suboptimal clinical outcomes
Fase 2: Optimal Zone (Moderate Dose)
- 3-10 J/cm²: Peak therapeutic effect
- Maximum ATP production
- Optimal gene expression
- Best clinical outcomes
Fase 3: Inhibition Zone (High Dose)
20 J/cm²: Reduced or reversed effects
- CcO saturation/overactivation
- Excessive ROS production
- Potential cellular stress
Why Does Biphasic Response Occur?
Mitochondrial Mechanisms
The biphasic effect at the cellular level involves several interconnected mechanisms:
1. Cytochrome c Oxidase Saturation
- CcO has finite capacity for photon absorption
- Moderate light: Optimal electron transport activation
- Excessive light: Enzyme saturation, reduced efficiency
- See Topic 02 for detailed CcO mechanism
2. Reactive Oxygen Species (ROS) Thresholds
- Low ROS: Signaling molecules that activate protective pathways
- Moderate ROS: Optimal activation of NF-κB, Nrf2 pathways
- High ROS: Oxidative damage, cellular stress response
3. Calcium Signaling
- Light-induced calcium influx follows biphasic pattern
- Moderate calcium: Activates transcription factors
- Excessive calcium: Mitochondrial dysfunction, apoptosis signaling
4. Heat Production
- High irradiance can cause tissue heating (>1°C)
- Heat stress triggers protective/inhibitory responses
- Thermal effects independent of photochemical mechanisms
Tissue-Specific Variations
Different tissues exhibit varying optimal dose ranges:
| Tissue Type | Optimal Dose (J/cm²) | Rationale |
|---|---|---|
| Pelle | 3-6 | High mitochondrial density, superficiale |
| Muscolo | 6-10 | Deeper penetration needed, high metabolic demand |
| Brain | 10-20 | Transcranial delivery losses, high CcO content |
| Joints | 8-15 | Cartilage avascularity, requires deeper penetration |
| Wounds | 4-8 | Inflammatory phase considerations |
Clinical Evidence for Biphasic Dosing
Key Research Studies
Karu et al. (1993) – Dose-Response Foundation
- Demonstrated biphasic effects in cell cultures
- Identified optimal dose ranges for different wavelengths
- Established dose-effect relationships still referenced today
- PubMed Link
Huang et al. (2011) – ROS Mechanism
- Showed ROS production follows biphasic curve
- Linked ROS thresholds to cellular outcomes
- Explained inhibition at high doses
- PubMed Link
Hawkins & Abrahamse (2006) – Wound Healing
- Demonstrated optimal dose for fibroblast proliferation
- Showed reduced healing at excessive doses
- Validated 3-5 J/cm² for skin applications
- PubMed Link
Tata & Waynant (2011) – Brain Applications
- Identified higher optimal doses for transcranial PBM
- Accounted for tissue scattering and absorption
- Established 10-20 J/cm² for neurological applications
- PubMed Link
Practical Dosing Guidelines
Calculating Your Dose
The basic formula for PBM dosing:
Dose (J/cm²) = Irradiance (mW/cm²) × Time (seconds) / 1000

Example Calculations:| Device Irradiance | Treatment Time | Dose Delivered |
|---|---|---|
| 30 MW/cm² | 10 minuti (600s) | 18 J/cm² |
| 50 MW/cm² | 10 minuti (600s) | 30 J/cm² |
| 100 MW/cm² | 5 minuti (300s) | 30 J/cm² |
| 65 MW/cm² | 10 minuti (600s) | 39 J/cm² |
WakeLife Beauty Dosing Standards
Our Ricerca & Sviluppo team has established optimal dosing parameters through extensive testing:
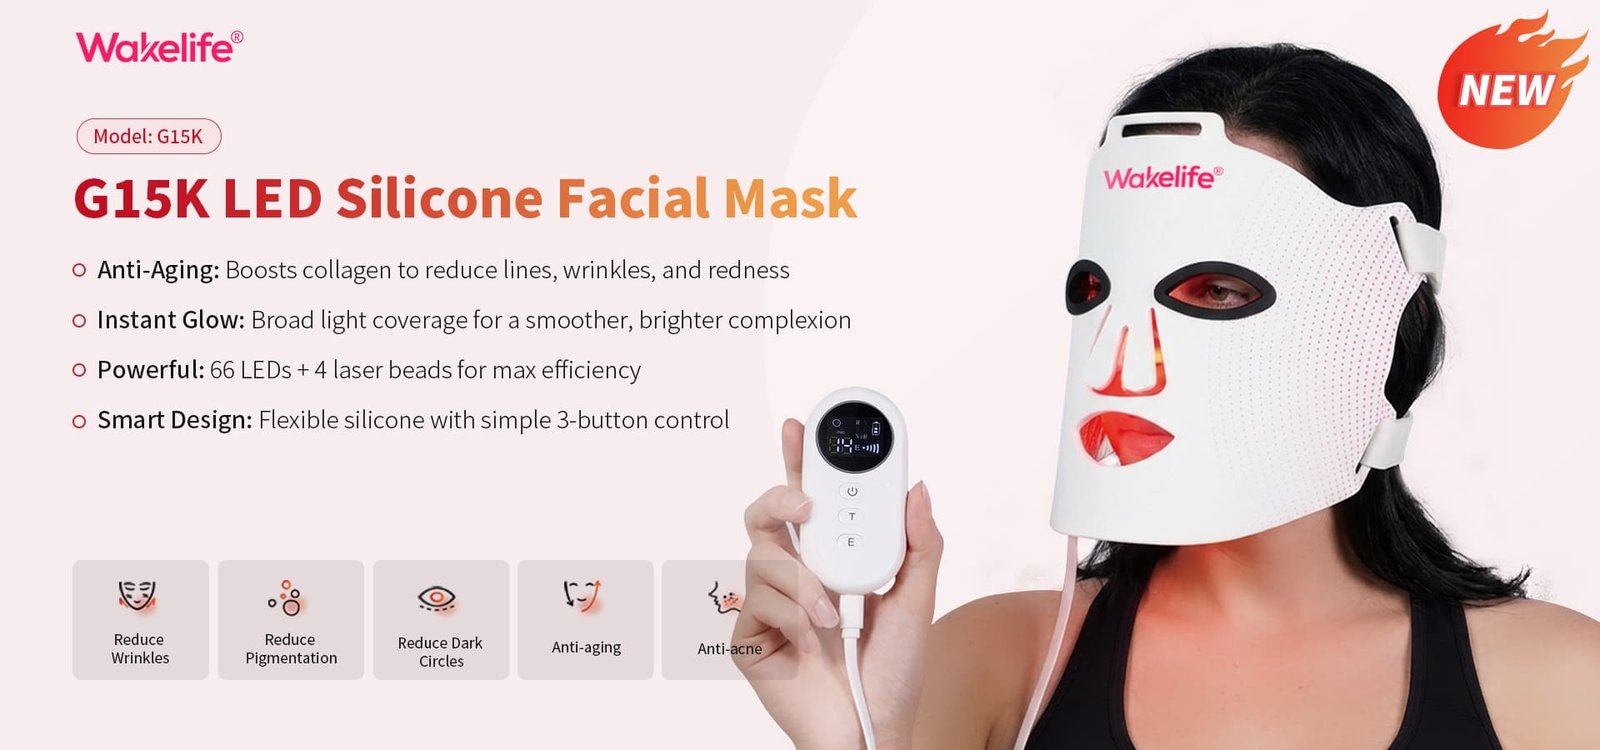
G15 Maschera per il viso a led:
- Irraggiamento: 65 mW/cm² at surface
- Recommended time: 10-15 minuti
- Dose delivered: 39-58.5 J/cm²
- Optimized for facial skin within biphasic optimal zone
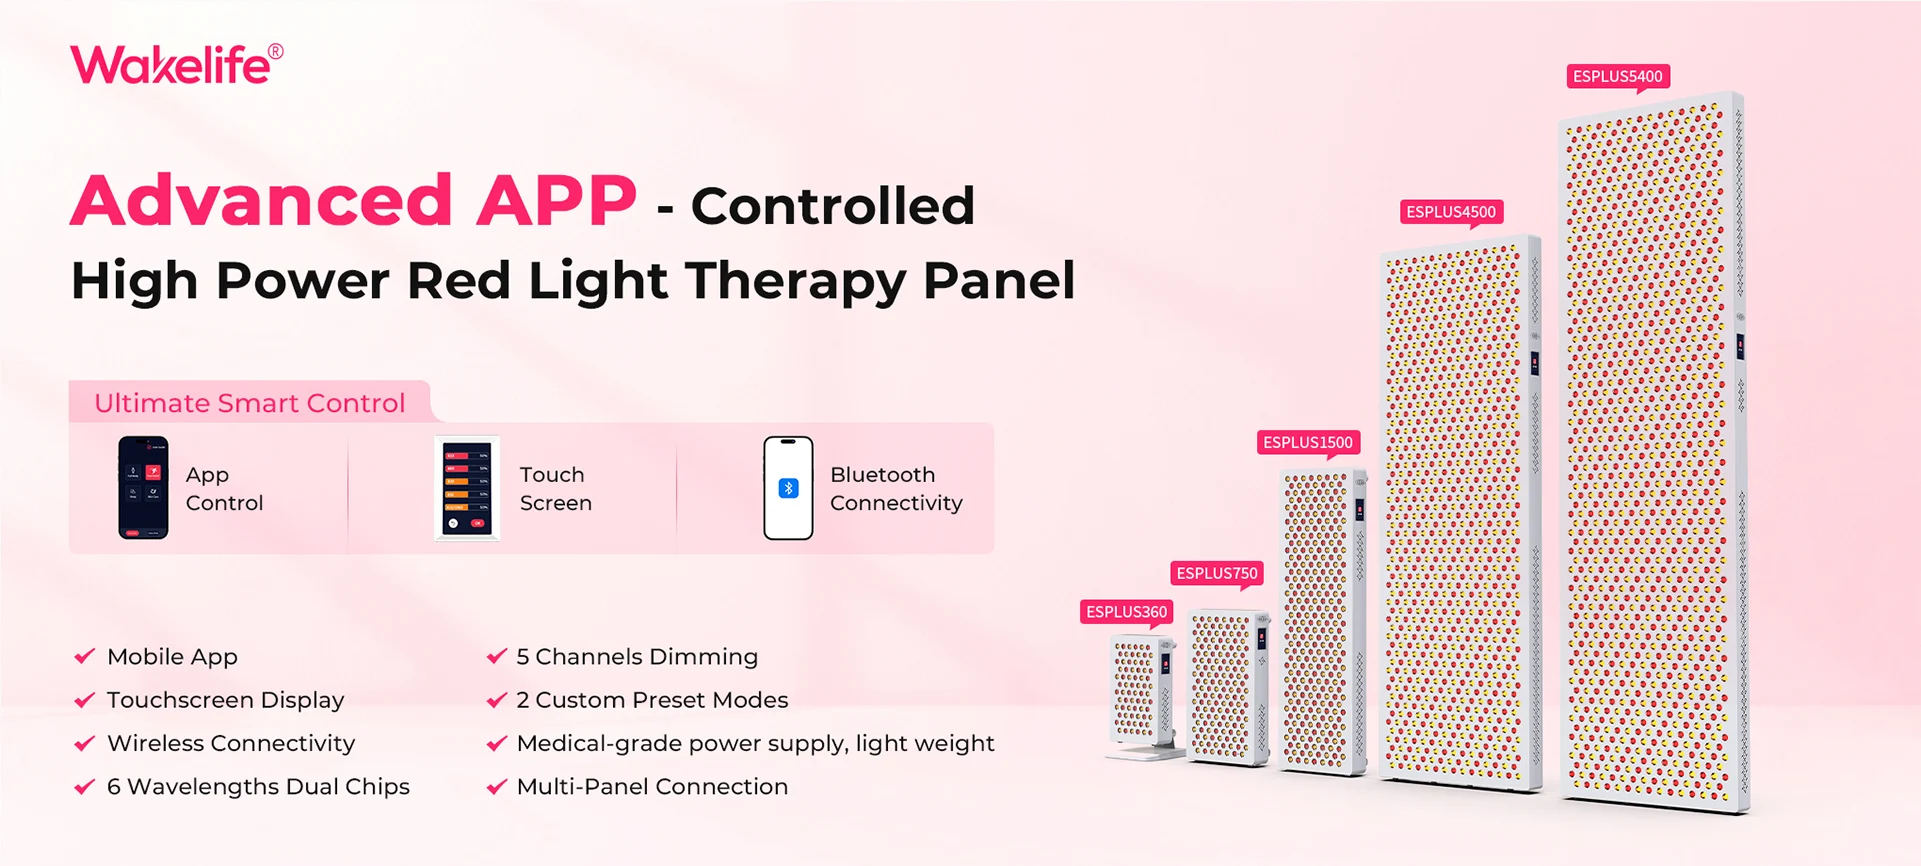
Therapy Panels:
- Irraggiamento: 100-150 mW/cm² at surface
- Recommended time: 8-12 minuti
- Dose delivered: 48-108 J/cm²
- Adjusted for body tissue depth
Key Design Principles:
- All devices calibrated to deliver optimal dose, not maximum power
- Treatment timers prevent excessive dosing
- Distance guidelines ensure consistent irradiance
- Qualità & Conformità documentation for every device
Common Dosing Mistakes
Mistake 1: “More Power = Better Results”
Reality: Biphasic curve shows excessive power pushes into inhibition zone. UN 200 mW/cm² device used for 20 minutes delivers 240 J/cm²—far beyond optimal and potentially counterproductive.
Mistake 2: Ignoring Treatment Distance
Reality: Irradiance decreases with distance squared (legge dell’inverso del quadrato). Device specifications at surface may not reflect actual dose delivered to target tissue.
Mistake 3: One-Size-Fits-All Protocols
Reality: Pelle, muscle, and brain require different optimal doses. Using facial protocols for deep tissue yields suboptimal results.
Mistake 4: Inconsistent Treatment Timing
Reality: Biphasic effects require consistent dosing. Sporadic use or variable durations prevent optimal cellular adaptation.
FAQ
What is biphasic dose response?
Biphasic dose response means that low doses of light stimulate, moderate doses optimize, and high doses inhibit cellular function. It’s also called the Arndt-Schulz curve and explains why more light isn’t always better in PBM.
What is the optimal dose for red light therapy?
Optimal dose typically ranges from 3-10 J/cm² for superficial tissues (skin) A 10-20 J/cm² for deep tissues (brain, articolazioni). The exact optimal dose depends on wavelength, tissue type, and treatment goal.
Can too much red light be harmful?
While not dangerous like UV light, excessive red light can push into the inhibition zone of the biphasic curve, reducing or reversing therapeutic benefits. It may also cause temporary tissue heating.
How do I calculate the dose I’m receiving?
Dose (J/cm²) = Irradiance (MW/cm²) × Time (seconds) / 1000. Per esempio, 50 mW/cm² for 10 minuti (600 seconds) = 30 J/cm².
Why do some devices have much higher irradiance?
Higher irradiance allows shorter treatment times to achieve the same dose. Tuttavia, excessive irradiance (>200 MW/cm²) risks pushing into the inhibition zone unless treatment time is proportionally reduced.
Does the biphasic curve apply to all wavelengths?
SÌ, though the specific optimal dose may vary slightly by wavelength. The general biphasic pattern holds across the 600-1000 nm therapeutic range.
How does tissue type affect optimal dose?
Different tissues have varying mitochondrial density, blood flow, and optical properties. Brain tissue (high CcO) may need higher doses than skin (more superficial, easier penetration).
What happens if I exceed the optimal dose?
Excessive dosing can: (1) saturate CcO reducing efficiency, (2) produce excessive ROS causing oxidative stress, (3) trigger inhibitory cellular responses, E (4) potentially cause mild tissue heating.
Conclusione
The biphasic dose response is one of the most important yet least understood principles in photobiomodulation. It explains why:
- More power ≠ better results
- Treatment time matters as much as device brightness
- Professional and home devices can both be effective with proper protocols
- Consistency trumps intensity
For device manufacturers, respecting the biphasic curve means engineering products that deliver optimal doses—not maximum power. This requires:
- Precise irradiance calibration
- Clear treatment protocols
- User education about proper use
- Quality control ensuring consistent output
For users, understanding biphasic dosing empowers better decision-making:
- Evaluating device specifications critically
- Following recommended treatment times
- Setting realistic expectations
- Avoiding the “more is better” trap
At WakeLife Beauty, Nostro R&D E Qualità & Conformità teams work together to ensure every device is engineered within optimal dose parameters. Our commitment to science-based dosing distinguishes our products in a market often driven by marketing claims rather than biological reality.
The biphasic curve reminds us that biology follows its own rules—rules discovered through decades of research and validated through clinical application. Understanding and respecting these rules is the difference between effective photobiomodulation and expensive placebo.
Related Topics
- Topic 01: Fotobiomodulazione (PBM): Definizione, Meccanismo & Storia
- Topic 02: Citocromo c ossidasi: The Primary Photoacceptor
- Topic 04: Downstream Effects of PBM: ATP, Infiammazione & Difesa antiossidante
- Topic 07: Irraggiamento, Densità di energia & Dosimetria: Complete PBM Parameter Guide
View all 30 topics: Complete Red Light Therapy Guide
Riferimenti
Aumento, T. (1993). Photobiological fundamentals of low-power laser therapy. IEEE Journal of Quantum Electronics, 23(10), 1703-1717. https://pubmed.ncbi.nlm.nih.gov/7504398/
Huang, Y. Y., et al. (2011). Risposta di dose bifasica in terapia con luce di basso livello: un aggiornamento. Dose-risposta, 9(4), 602-618. https://pubmed.ncbi.nlm.nih.gov/21214658/
Hawkins, D., & Abrahamse, H. (2006). The role of laser fluence in cell viability, proliferation, and membrane integrity of wounded human skin fibroblasts following helium-neon laser irradiation. Lasers in Surgery and Medicine, 38(1), 74-83. https://pubmed.ncbi.nlm.nih.gov/16706699/
Tata, D. B., & Waynant, R. W. (2011). Terapia laser: a review of its mechanism of action and potential medical applications. Laser Physics, 21(3), 1-12. https://pubmed.ncbi.nlm.nih.gov/21875329/
Chung, H., et al. (2012). I dadi e i bulloni del laser di basso livello (leggero) terapia. Annali di ingegneria biomedica, 40(2), 516-533. https://pubmed.ncbi.nlm.nih.gov/22045511/